
Justin Gonzales
DATA · AUTOMATION · DASHBOARDS
Hiring for a project rather than a role? justgonzales.com
I'm Justin, a business process and automation consultant based in Metro Manila.I spent years inside a BPO supporting one of the largest U.S. telecom companies — where I didn't just track performance, I built the tools that made tracking possible.Excel dashboards, automated reporting pipelines, SharePoint hubs, incentive calculators — all built under real constraints, for real teams making real decisions.Since then I've taken that same approach freelance: helping a U.S. marketing firm automate their campaign data and building a full CRM and workflow system for an Australian insurance brokerage.
PROJECTS
BPO Operations Analytics
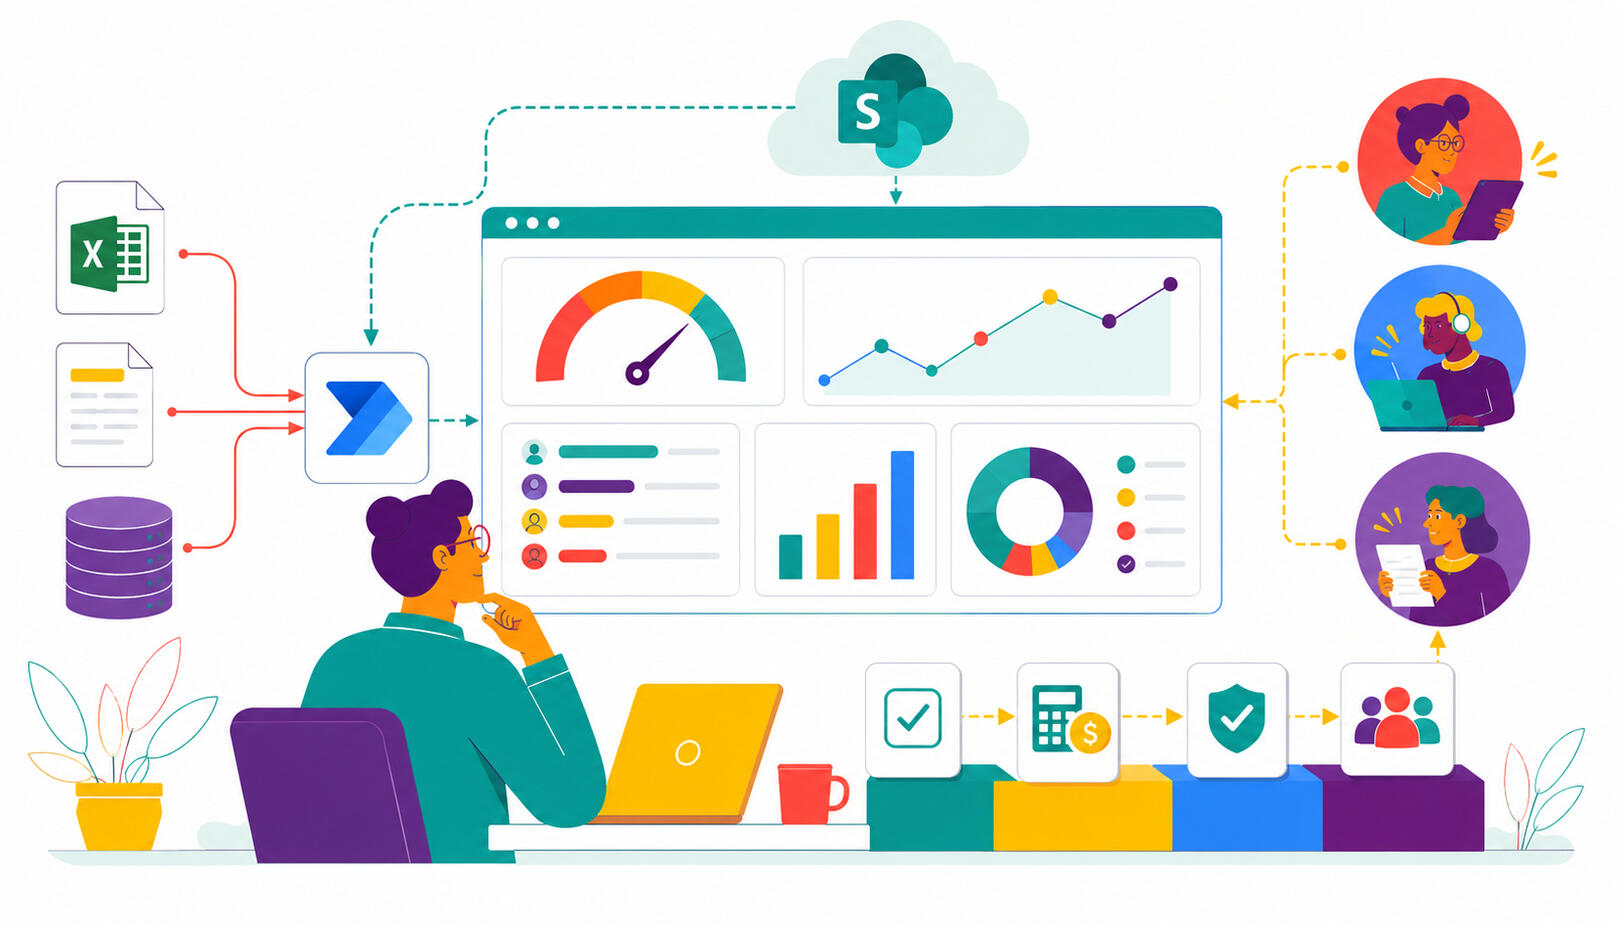
Built a full operational reporting suite using Excel, Power Automate, and SharePoint without access to the enterprise Power BI environment. Dashboards covered NPS performance, stack ranking, incentive calculations, and compliance tracking, used daily by leadership across a 700+ person operation.
Marketing Campaign Analytics
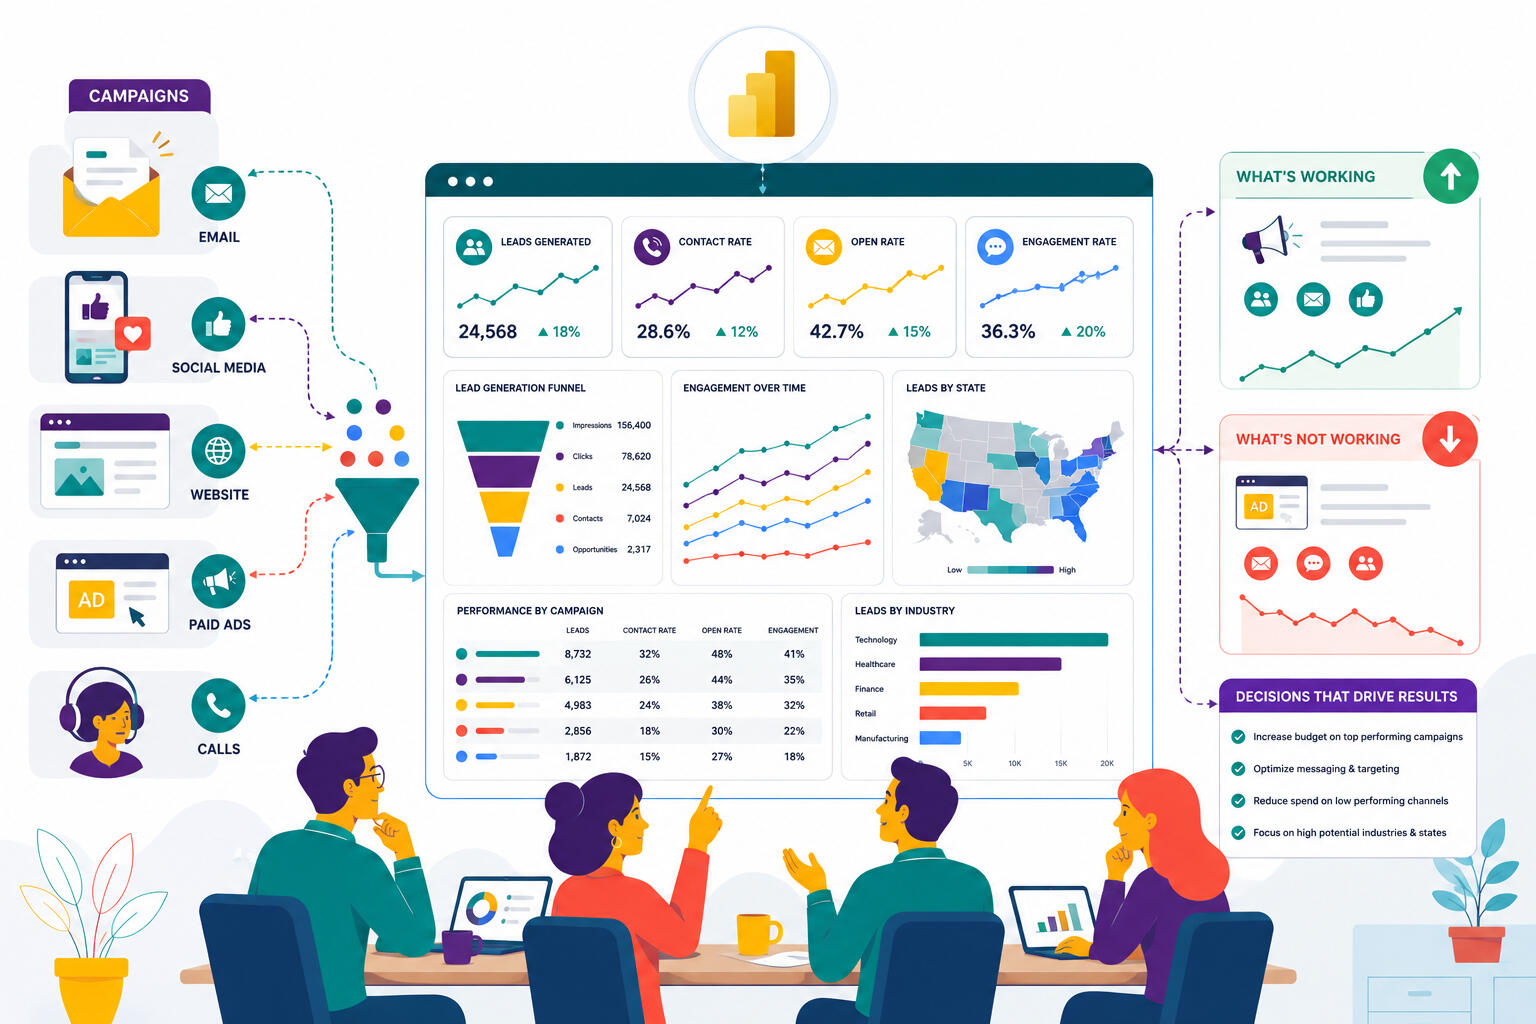
Built a Power BI dashboard tracking lead generation, contact rates, open rates, and engagement across campaigns, states, and industries, giving leadership clear visibility into what was working and what wasn't.
CRM & Workflow Automation
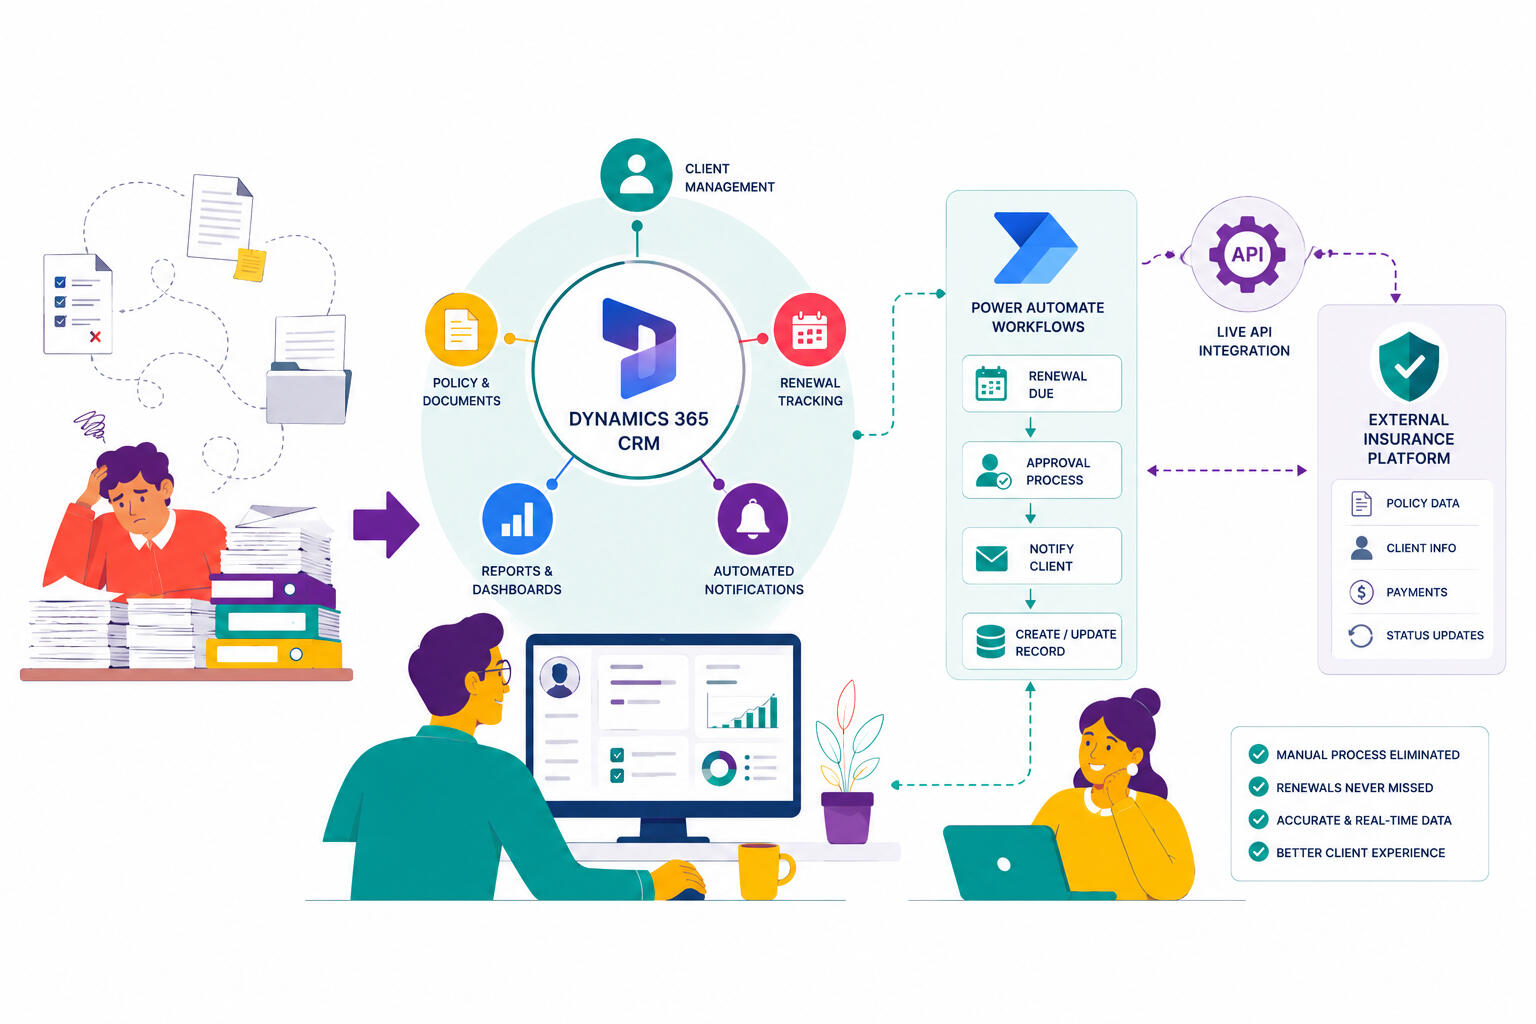
Extended a locked-down industry platform with a custom Dynamics 365 CRM, adding the workflows, automation, and visibility the platform couldn't provide, with a two-way API integration keeping both systems in sync.
BPO Operations Analytics
As an offshore BPO supporting a major U.S. telecom client, our site had visibility into global Power BI reports but no ability to request or customize what we needed to see. Rather than work blind, I built our own reporting layer using the tools we had: Excel, Power Automate, SharePoint, and Microsoft Forms, pulling data from Power BI exports so everything stayed current. KPIs were already defined by the client, but for operational metrics that sat outside the standard framework, I collaborated directly with the director and senior managers to identify what mattered, agree on the calculations, and build views that actually drove decisions.
The Challenge
The site was part of a global BPO operation supporting a major U.S. telecom client. While enterprise Power BI reports existed, they were managed at a global level meaning the local team had visibility into numbers but no ability to request custom views, drill into what mattered locally, or track the specific metrics that drove their site's performance. Operational decisions were being made with incomplete visibility, and there was no centralized place for leadership to monitor performance, track incentives, or identify issues before they escalated.
How I Helped
Rather than waiting for access that wasn't coming, I built a local reporting layer using the tools available such as Excel, Power Automate, SharePoint, and Microsoft Forms, pulling from Power BI exports to keep data current without needing direct access. I collaborated with the director and senior managers to identify the metrics that actually mattered beyond the standard KPIs, agreed on the calculations, and built dashboards that leadership could use daily. Deliverables included NPS performance tracking, stack ranking across sites, monthly incentive bonus calculators, compliance monitoring, outlier tracking, and a quick response dashboard. All consolidated into a SharePoint hub accessible to the entire operation.
Stack Rank
Leadership needed a way to compare site performance across divisions without manually compiling numbers from multiple sources. This dashboard gave them a single ranked view of every site's overall percent to goal across Account and Tech divisions updated automatically so the numbers were always current and ready for leadership discussions.
NPS Cohort Dashboard
Customer satisfaction scores were being tracked globally but not in a way that helped the local team act on them. This dashboard broke NPS performance down by tenure group, day of week, and account outlier segments giving coaches and managers a precise view of where promoters were being won and where detractors were being lost throughout the week.
Quick Response Dashboard
There was no visibility into whether quick responses were being completed, how fast they were being closed, or what was driving customer outcomes. This dashboard tracked QR status, closure times, contact rates by day of week, manager performance, root causes, actions taken, and customer responses giving operations a complete picture of quick response activity from start to finish.
Outlier Tracker
Certain accounts consistently underperformed but weren't easy to isolate in the global reports. This tracker flagged outlier accounts week over week, making it easier for managers to prioritize coaching and intervention where it would have the most impact.
Outlier Tracker (Rep Level)
The account-level tracker showed where the problem was, but not who was driving it. This rep-level version drilled down to individual performance, giving coaches a direct line of sight to which reps needed support and what specifically was pulling their numbers down.
Real Time Performance Tracker
Between scheduled reports there was no visibility into how the site was performing moment to moment. This tracker gave operations a live view of key metrics by time block throughout the day, making it possible to spot performance dips as they happened and course correct before the day closed.
Challenger Bonus Calculator
Incentive projections were being calculated manually, which was time-consuming and prone to error. This calculator automated bonus eligibility in real time based on each rep's current performance across weighted metrics, giving reps visibility into where they stood and motivating performance without waiting for end-of-month results.
The Outcome
With a centralized reporting layer in place, the site's leadership team went from chasing numbers across disconnected sources to having a single, automated view of everything that mattered — updated regularly without manual effort.
Here's what that translated to in practice:• Report generation time reduced by 83% through automated pipelines
• Corporate escalations dropped by 60% through consistent daily survey analysis
• Collections improved by 17% and sales by 10% through automated adoption tracking
• Increased revenue by 150% within six months during the Home Internet product launch
• SharePoint hub actively used by 700+ employees across the operationBy building a reporting infrastructure from the tools available without waiting for enterprise access that wasn't coming, the site gained the operational visibility it needed to make faster, more confident decisions and remain competitive across global locations.

Stack Rank

NPS Cohort Dashboard

Quick Response Dashboard

Outlier Tracker

Real Time Performance Tracker

Challenger Bonus Calculator


Marketing Campaign Analytics
A U.S.-based marketing firm needed better visibility into their campaign performance. Data was scattered, reporting was manual, and there was no single view of what was driving results. I built a Power BI dashboard consolidating campaign data across multiple dimensions: campaign type, state, industry, and time period and connected it with Power Automate workflows to reduce manual data processing by 50%.
The Challenge
A U.S.-based marketing firm was running multiple email campaigns across different industries, states, and offer types but had no centralized way to see how those campaigns were actually performing. Data was sitting in MySQL databases and spreadsheets with no single view connecting lead generation, contact rates, open rates, and engagement together. Leadership was making campaign decisions without clear visibility into what was working, what wasn't, and where to focus next.
How I Helped
I built a Power BI dashboard that consolidated all campaign performance data into one place, connected directly to their MySQL database so it stayed current without manual exports or updates.Email Campaign Performance Dashboard
There was no single view showing how campaigns were performing across all the dimensions that mattered campaign type, industry, state, offer, and time period. This dashboard gave leadership a complete picture in one place: total leads, completion rates, contact rates, open rates, bounce rates, and unsubscribes at the top level, with the ability to filter by campaign name, state, industry, offer, and date range. It also surfaced which campaigns and states were driving the highest open rates, and tracked weekly open rate performance over time so trends were visible at a glance.Beyond the dashboard, I implemented Power Automate workflows connecting MySQL, Excel, SharePoint, and Dynamics to automate data transfers that were previously being done manually — cutting manual processing time by 50%. I also enriched and validated over 5,000 marketing leads using Clay, ZoomInfo, and Apollo to improve data quality going into the campaigns.
The Outcome
With a centralized dashboard and automated data pipelines in place, the team went from manually pulling and compiling campaign data to having a live, filterable view of everything that mattered updated automatically without anyone having to touch it.
Here's what was translated to in practice:• Manual data processing time reduced by 50% through Power Automate workflows connecting MySQL, Excel, SharePoint, and Dynamics
• 5,000+ marketing leads enriched and validated, improving data quality and outreach engagement rates by 15%
• Database retrieval speed improved by 40% through better database design for enriched lead data
• Leadership gained a single filterable view of campaign performance across multiple campaigns, states, industries, and offer types — replacing scattered manual reportingBy connecting the data sources, automating the transfers, and building a dashboard that surfaced what actually mattered, the team could make faster and more confident decisions about where to focus their campaign efforts.

Email Campaign Performance Dashboard

CRM & Workflow Automation
An Australian professional services firm had a clear picture of how they wanted to operate, but the industry platform they relied on couldn't be customized to support it. Anything beyond what the vendor offered, such as deadline tracking, workflows, and daily tasks, was handled manually across spreadsheets and email, with no automation and no central visibility. I designed and built a Dynamics 365 Sales Pro CRM alongside their existing platform, connected the two via API so data flowed both ways automatically, and consolidated everything into a single Microsoft environment their team could work from daily.
The Challenge
An Australian professional services firm managed its clients in an industry platform provided by a third-party vendor. The platform handled the core records, but the firm couldn't customize it: no way to add the features, workflows, or tracking they needed. Anything outside what the vendor offered was handled manually in spreadsheets and email, data was entered into more than one place, and the team had no single view of where each client stood.
How I Helped
The solution wasn't just building a CRM. It was rebuilding how the entire operation ran, from client management to process compliance, inside a single connected environment. Rather than replacing the platform they depended on or forcing the team to adapt to off-the-shelf software, I designed everything around how the firm actually worked.CRM Architecture
The foundation was a Dynamics 365 Sales Pro environment built to manage the full client lifecycle: accounts, contacts, leads, opportunities, and the firm's core service records, all in one place. Custom business process flows were mapped to mirror exactly how the firm handles its recurring client deadlines, so every critical step was tracked and nothing could be skipped or forgotten. Automated notifications replaced the manual Excel tracking that had been the only safety net for those deadlines, so the team was alerted automatically instead of having to remember to check.Industry Platform Integration via API
The firm's existing industry platform was provided by a third-party vendor and couldn't be customized, so it operated in its own silo. Client records had to be manually duplicated across both systems, creating double handling and room for error. I built API integrations that pushed and pulled data between Dynamics 365 and the platform automatically, so records stayed in sync across both systems without anyone having to touch them twice. The platform stayed the system of record, and the CRM added everything it couldn't do.One Environment, One Login
Before this, the team was working across multiple accounts, tools, and platforms: Outlook in one window, the industry platform in another, tasks managed somewhere else entirely, and a SharePoint site that required separate credentials. I rebuilt everything within the firm's own Microsoft tenant, connecting Outlook, tasks, the CRM, and a dedicated SharePoint site into a single environment. The team went from constant context switching to opening one tool and having everything they needed in front of them.Lead to Opportunity Automation
Potential clients submitting interest forms were being handled manually: someone had to pick up the form, create a lead, and move it through the pipeline by hand. I automated the entire flow so form submissions were captured directly as leads in the CRM and moved through the pipeline automatically, freeing the team to focus on the conversation rather than the admin.Data Preparation for Outreach Campaigns
Beyond the CRM build, I also supported the firm's outreach by cleaning and preparing large batches of recipient data for email campaigns. Each row represented a real recipient, so accuracy wasn't optional. Any error meant an email going out with wrong or missing information, which was a risk the business couldn't afford. I streamlined the process to cut turnaround from days to hours without compromising accuracy.
The Outcome
With everything consolidated into a single Microsoft tenant and connected through automation and API integrations, the firm went from managing clients across disconnected tools to having one environment where everything worked together.Here's what that translated to in practice:• Deadline tracking moved from manual Excel extraction to automated CRM notifications, with no more missed deadlines or manual cross-referencing
• Client data stayed in sync across Dynamics 365 and the industry platform automatically through API integration, eliminating duplicate manual entry
• The firm gained the workflows and features their vendor platform couldn't provide, without having to replace it
• The team went from multiple disconnected tools to one connected Microsoft environment covering CRM, Outlook, tasks, and SharePoint
• Lead to opportunity automation captured potential clients and moved them through the pipeline without manual intervention
• Campaign data preparation went from days to hours, without compromising the accuracy every outreach requiredBy giving the firm the tools to match the structure they already had in mind, the team could focus on serving clients instead of managing the chaos of disconnected systems.